The Invisible & Unspoken Pivots
In short: I applied the formula of traditional Pivots to calculate R6 to R10 and S6 to S10 Pivots into a new Indicator. Was it worth the time? Did It land me on the Pivots moon? Here is a walk-through the process
This, is how your average Yearly Pivot chart looks like:

In this case, the chart above is the Yearly S&P 500 chart, on it are plotted Traditional Yearly Pivots (P), and their respective Resistance levels named R1-R5 and Support levels named S1-S5.
As you probably can notice, there are not more than five levels of Support or Resistance in each direction. Why is it that Chartists don’t use more than those five Pivot levels? As a historical search have yield no real answer I could only speculate that simply no one ever bothered to calculate them since markets did not put that to the test with their volatility, price behavior and returns - as you can see from the S&P chart above - Indeed there is no need for more Pivots.
Before I’ve created this indicator, I was noticing that while indeed the upside that Pivots offer to the R5, or the down side to the S5, in legacy markets is so great that in MOST cases it is not required, there are other markets which are desperate for it. I was theorizing that the simple act of calculating and plotting an R6, R7 and above, might be useful for the market I’ve been charting for a few years now - a market that almost made it a habit to break above all plotted Pivots in a search for price discovery, on the outskirts of the price stratosphere: The crypto market!
You can see that very well in this Bitcoin yearly chart, where 2013 & 2017 were Moon years breaking above all R-levels:

Compare that to thew first chart above of the S&P500 and it’s a tell tale sign, one out of the many differences between those two and their nature.
Making the Calculation
Pivot Points were originally used by floor traders to set key levels. At the beginning of the trading day, floor traders would look at the previous day’s high, low and close to calculate a Pivot Point for the current trading day - the place where the bullish and bearish forces balance themselves out. With this Pivot Point as the base, further calculations were used to set support 1, support 2, resistance 1, and resistance 2. These levels would then be used to assist their trading throughout the day.
The same can be applied to higher time frames and serves as a very strong, predictive trading tool. The formula for those traditional Pivot Points (There are more types of Pivots, but we won’t get into that now) is simple as it is magical:
PP = (HIGHprev + LOWprev + CLOSEprev) / 3
R1 = PP * 2 - LOWprev S1 = PP * 2 - HIGHprev
R2 = PP + (HIGHprev - LOWprev) S2 = PP - (HIGHprev - LOWprev)
R3 = PP * 2 + (HIGHprev - 2 * LOWprev) S3 = PP * 2 - (2 * HIGHprev - LOWprev)
R4 = PP * 3 + (HIGHprev - 3 * LOWprev) S4 = PP * 3 - (3 * HIGHprev - LOWprev)
R5 = PP * 4 + (HIGHprev - 4 * LOWprev) S5 = PP * 4 - (4 * HIGHprev - LOWprev)
So now, the only thing left is to apply the same calculation from the R3/S3 on and roll it into the creation of the R6/S6 like this:
R6 = PP * 5 + (HIGHprev - 5 * LOWprev) S5 = PP * 5 - (5 * HIGHprev - LOWprev)
And so forth until R10/S10. Not a rocket science!
Moon Pivots?
My hope in plotting those never seen before Pivots was to discover thin air price levels in those times when price is mooning. Did it work? The bottom line is that it did, sometimes surprisingly so, but also to a lesser hit rate of the one I was hoping for.
In legacy markets there are some anecdotal rare successes where R6-R10 has marked a top or an important level. It is much more a question of playing with your pivot time frames. While plotting decade long pivots on the Nasdaq, the role that the R10 was playing at the end of the 1990’s and beginning of the millennium was obvious, as well as the R6 playing a big role just last year.

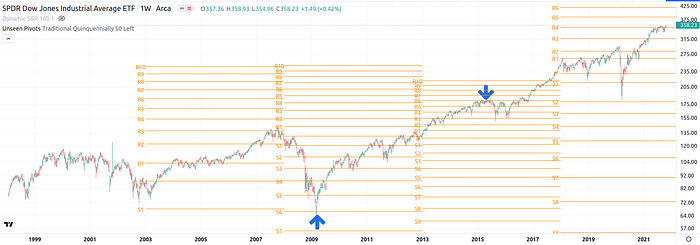
And here is the Dow on a five year period Pivots. What a buy opportunity on the S6 at the 2009 crisis, or the significance of the R6 throughout the whole of 2015.
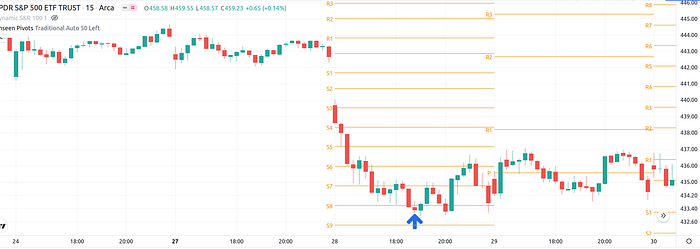
Or how about the Daily pivots for the 21st of last September when the SPY tanked to the S8? A demonstration that those pivot levels play a role not only on the high time frames, but also on the lower ones.
Levels on exponential moves
But where you can better see how those new Pivot levels play out is in Crypto markets. Maybe because of the speculative and exponential nature of them. It is however clear that even though some of the magic is there, it is lacking the success of traditional Pivots - those visible to all traders, that creates the self fulfilling prophecy and show Pivot traders the way.
But here is Ethereum’s Weekly chart at 2016 with Yearly Pivots:
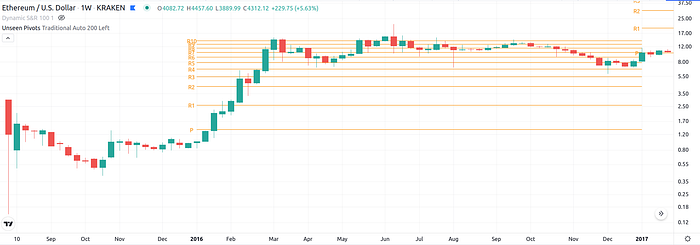
I’d say that they could have served as a road map for that year, as most of that Year’s action was revolving around the R6-R10. But this is also playing out at this year’s price action:
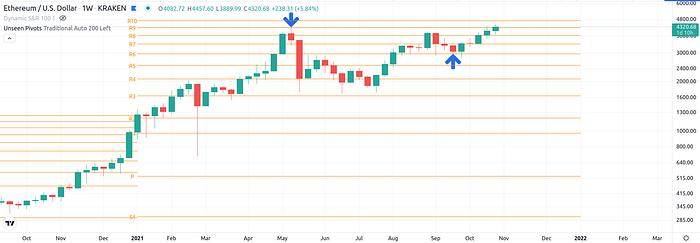
Clearly the R9 acted this year as the top back at May, while since August the R6 played as an undefeated support level.
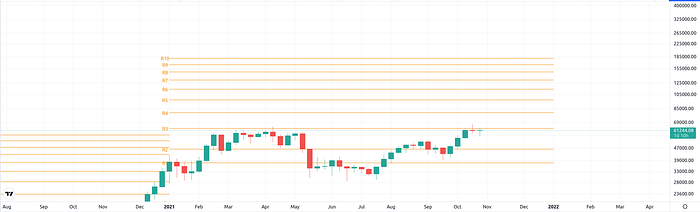
Here is Bitcoin at the epic times of 2017:
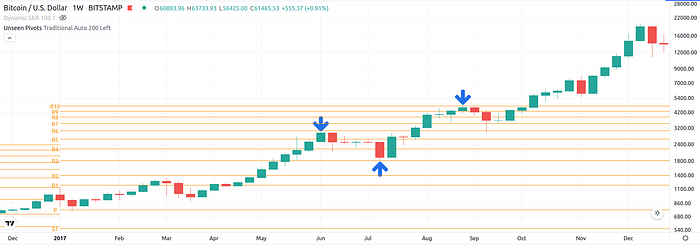
It is running through the year to the R6 for first rejection, then going to a local top at the R10, followed by a retrace to the R6 before leaving even those moon pivots behind.
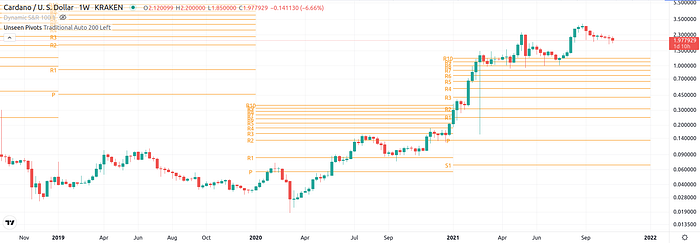
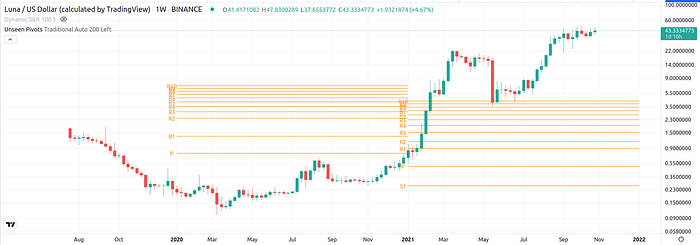
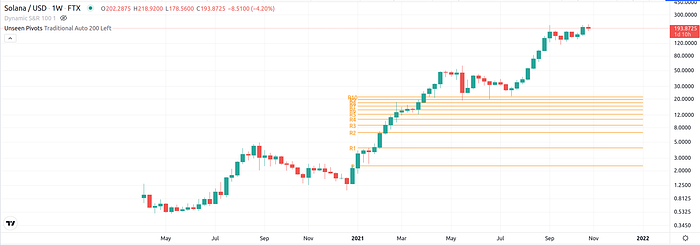
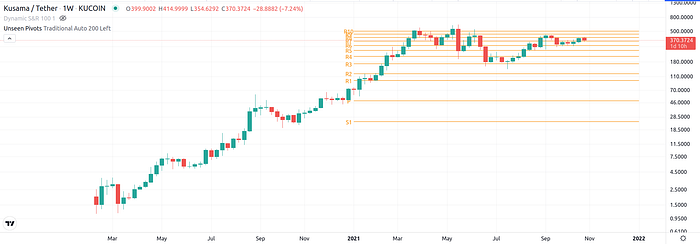
These are ADA, Luna, Solana and KSM. All been or are flirting with those Unseen Pivots in one way or another this year:
So what’s the take?
Honestly, I don’t know. A much deeper examination is needed and much caution while exercising those new never before seen levels. For me personally, there is sufficient evidence that these levels are playing some role and certainly manifest themselves on some assets. On some better than others.
Mainly, this is a fun experiment in uncovering more capabilities of an extremely powerful and old indicator, in a very banal way. It is most of all a proof that there is always something new to discover.
I’m going to end this with something for all Bitcoin moon boys and girls out there. This is this Year’s upside to the R10:
But what you should be looking for is a year that price breaks first above the R5 and then the R10 - those are the real MOON years!
If you do want to use those unseen pivots Indicator, you can do it here:
Join Coinmonks Telegram Channel and Youtube Channel learn about crypto trading and investing
Also, Read
- 3Commas Review | Pionex Review | Coinrule review
- Ledger vs Ngrave | Ledger nano s vs x | Binance Review
- Bybit Exchange Review | Bityard Review
- 3Commas vs Cryptohopper | Earn crypto interest
- The Best Bitcoin Hardware wallet | BitBox02 Review
- BlockFi vs Celsius | Hodlnaut Review | KuCoin Review
- Bitsgap review | Quadency Review | Bitbns Review
- Crypto Copy Trading Platforms | Coinmama Review
- Crypto exchanges in India | Bitcoin Savings Account
- OKEx vs KuCoin | Celsius Alternatives | How to Buy VeChain
- Binance Futures Trading | 3Commas vs Mudrex vs eToro
- How to buy Monero | IDEX Review | BitKan Trading Bot
- CoinDCX Review | Crypto Margin Trading Exchanges
- Bookmap Review | 5 Best Crypto Exchanges in the USA
- How to trade Futures on FTX Exchange | OKEx vs Binance
- CoinLoan Review | YouHodler Review | BlockFi Review
- ProfitTradingApp for Binance Review | XT.COM Review
- SmithBot Review | 4 Best Free Open Source Trading Bots
- Coinbase Bots | AscendEX Review | OKEx Trading Bots
- How to buy Bitcoin in India? | WazirX Review
- CryptoHopper Alternatives | HitBTC Review
- Fold App Review | Kucoin Trading Bot | Probit Review
- How to buy Bitcoin Anonymously | Bitcoin Cash Wallets
- Binance vs FTX | Best (SOL) Solana Wallets
- Binomo Review | Stoic vs 3Commas vs TradeSanta
- Capital.com Review | Crypto Lending Platforms in Hong Kong
- How to Swap Crypto on Uniswap? | A-Ads Review
- WazirX vs CoinDCX vs Bitbns | BlockFi vs CoinLoan vs Nexo

